Infographic Poster
A print-ready 36×24 landscape poster that combines the three core visualizations into one narrative for the Johnson Geo Centre.
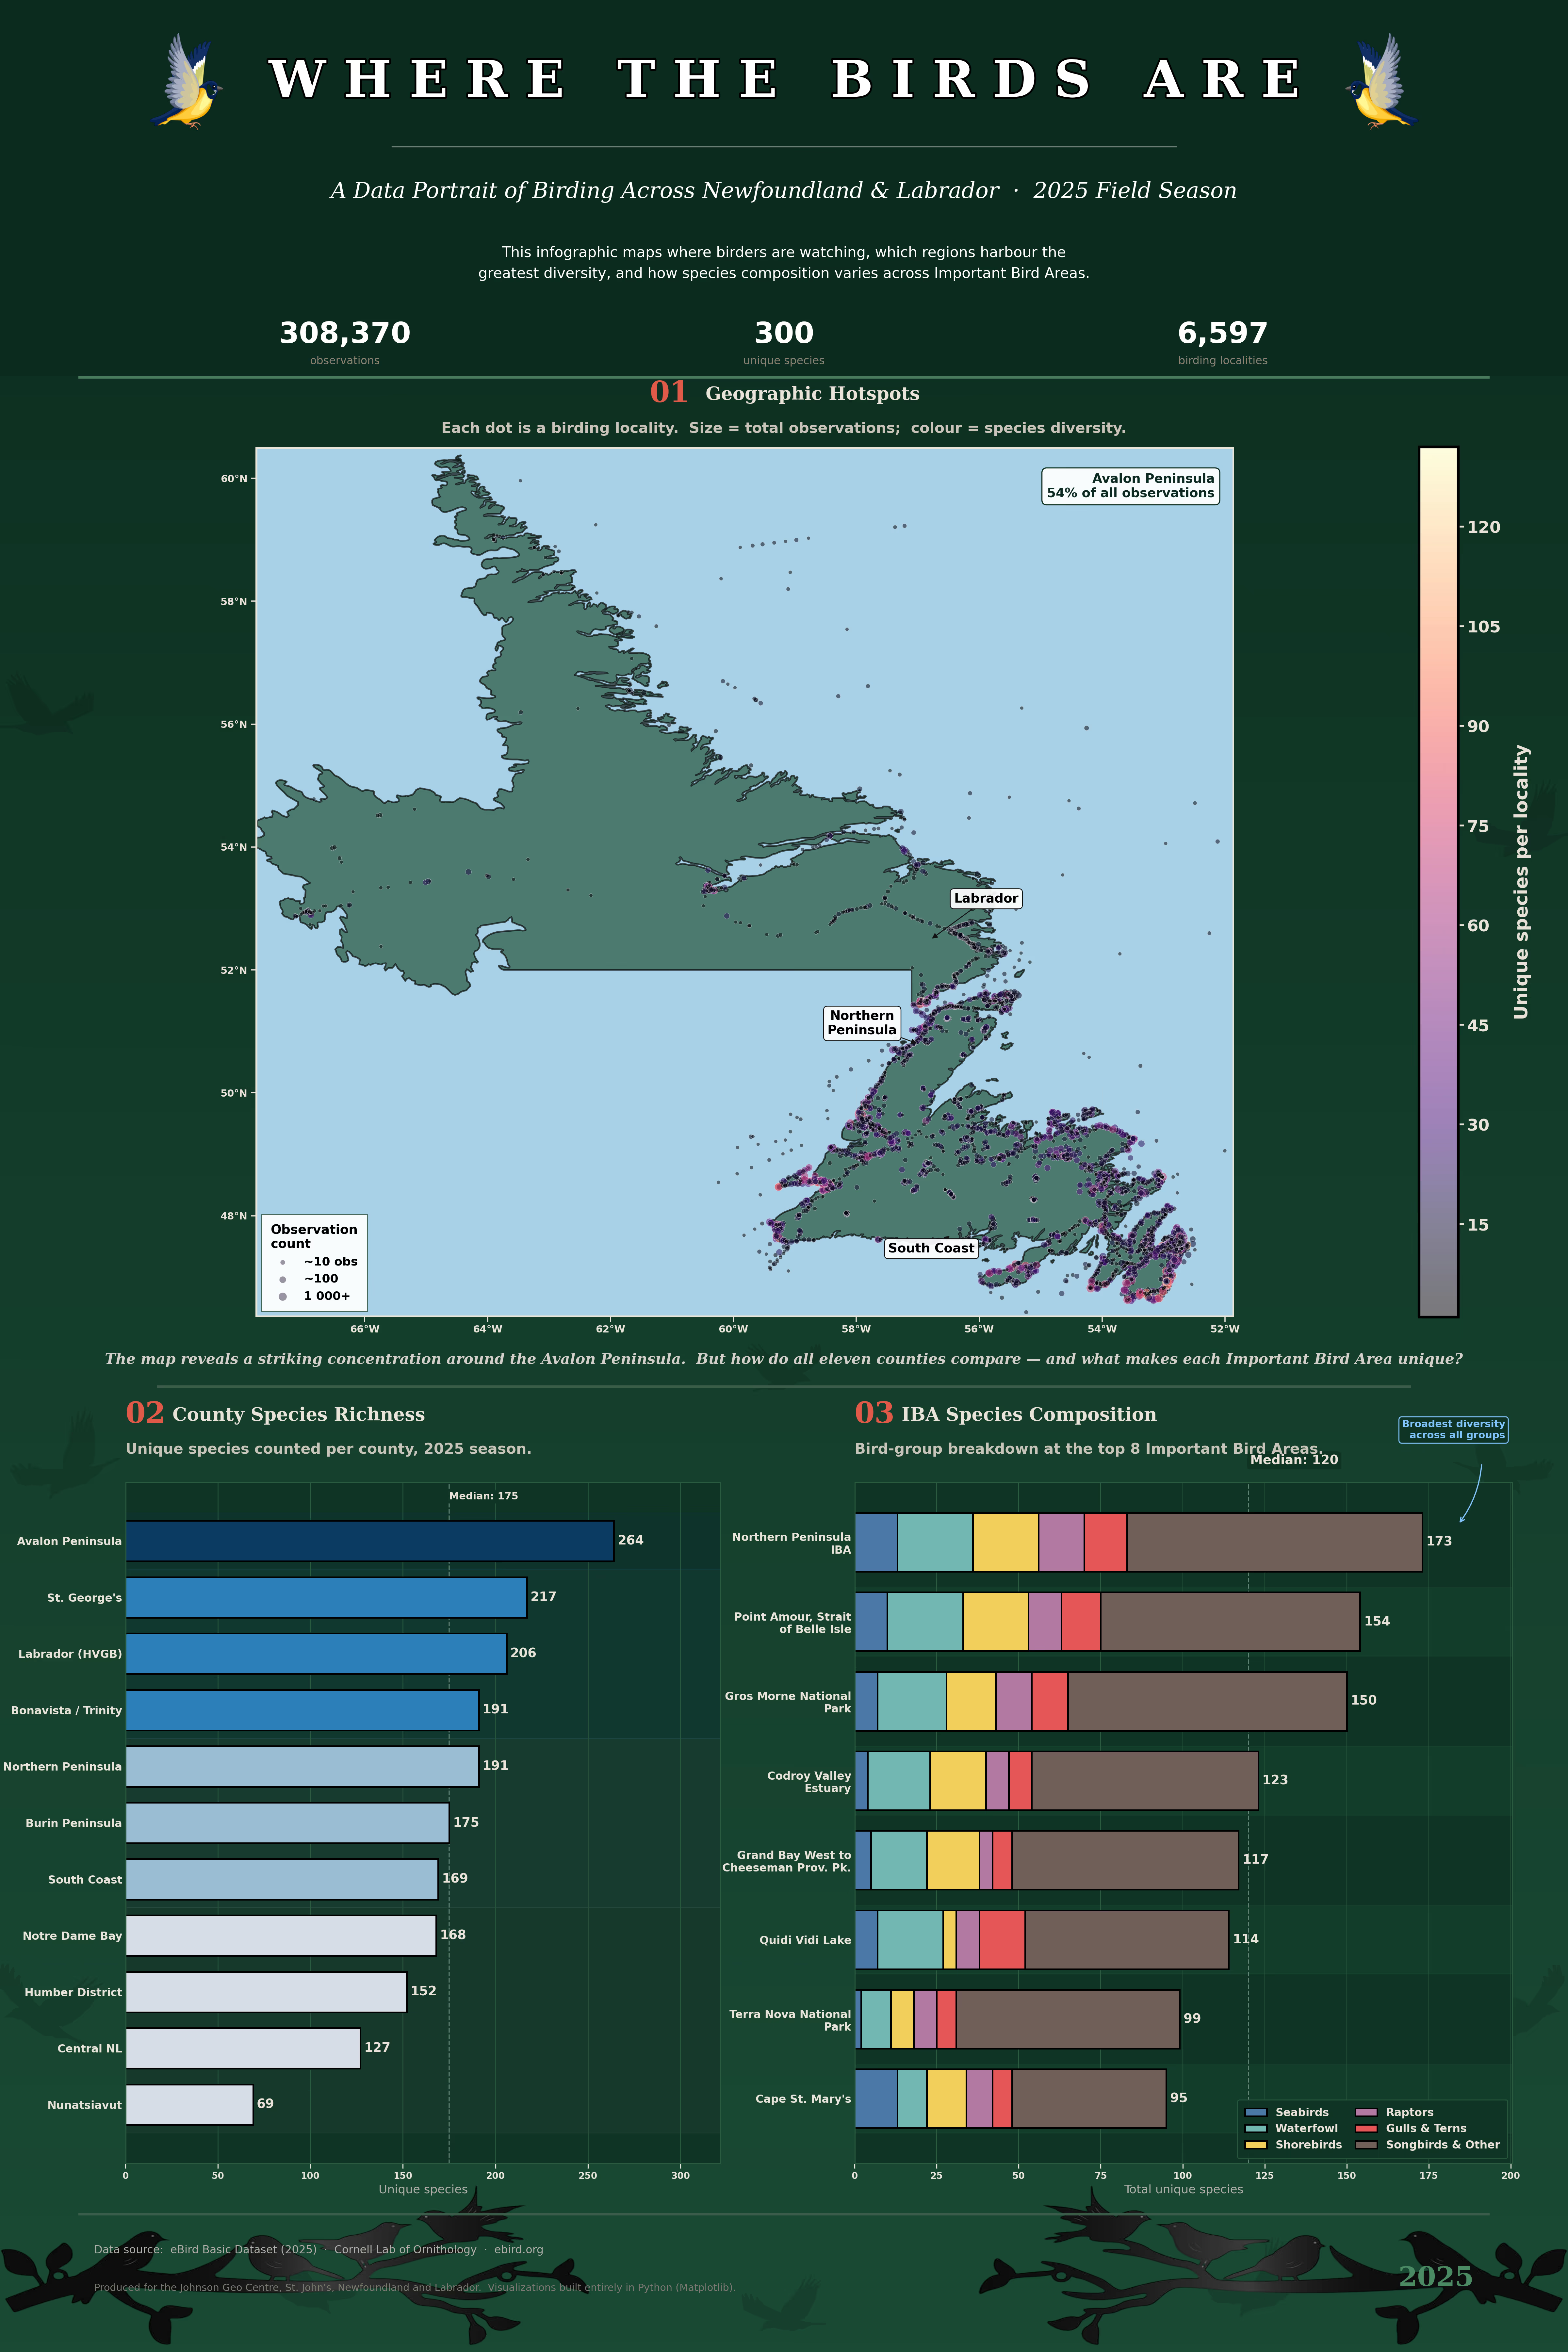
36 x 24 inch landscape poster · 200 DPI · Python / Matplotlib
Data Viz
A data portrait of birding across Newfoundland and Labrador, mapping diversity, hotspots, and habitat composition from the 2025 eBird field season.
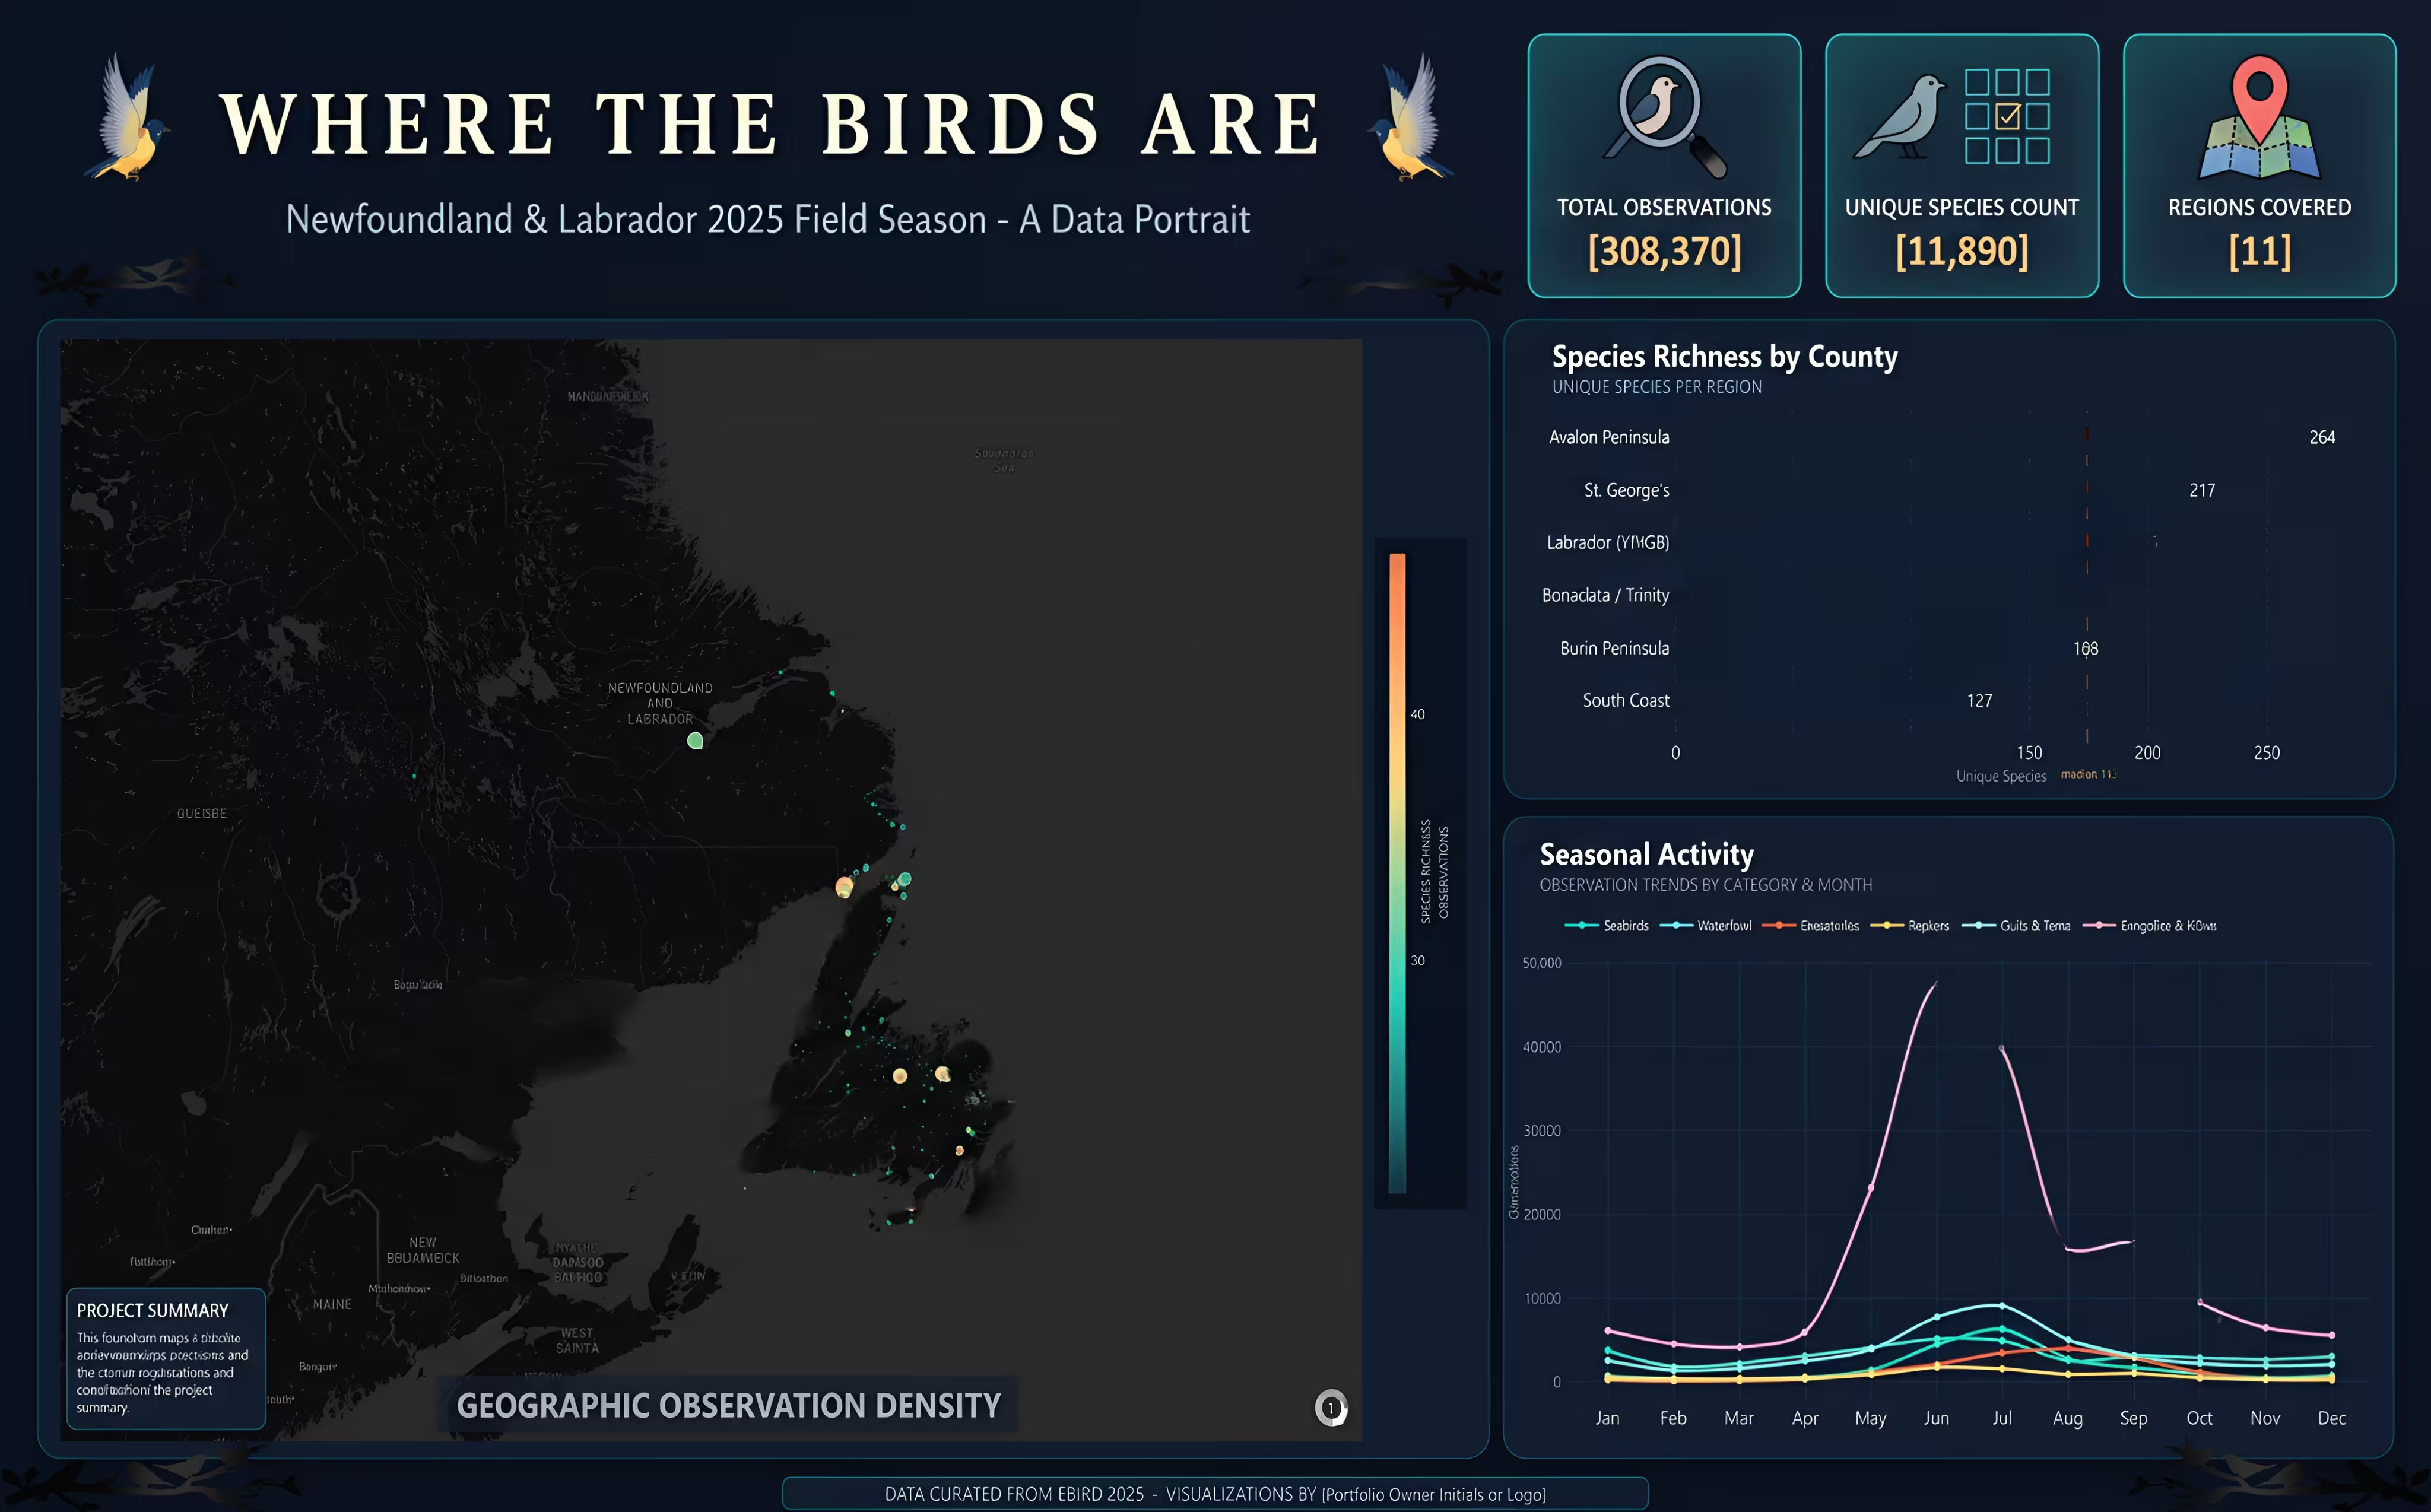
Produced for the Johnson Geo Centre in St. John’s, this infographic transforms thousands of citizen-science birding records into a single visual narrative. It shows where birders are watching, which regions have the highest diversity, and how species composition varies across Important Bird Areas.
The project includes a print-ready 36x24 landscape poster built in Python and Matplotlib, plus an interactive Dash dashboard for exploratory analysis. Data source: eBird Basic Dataset (2025), filtered to Newfoundland and Labrador.
A print-ready 36×24 landscape poster that combines the three core visualizations into one narrative for the Johnson Geo Centre.
36 x 24 inch landscape poster · 200 DPI · Python / Matplotlib
A Plotly Dash web app pairs with the poster so viewers can filter the eBird dataset by category, month range, and county, then explore hotspots, regional richness, and seasonal activity in one place.
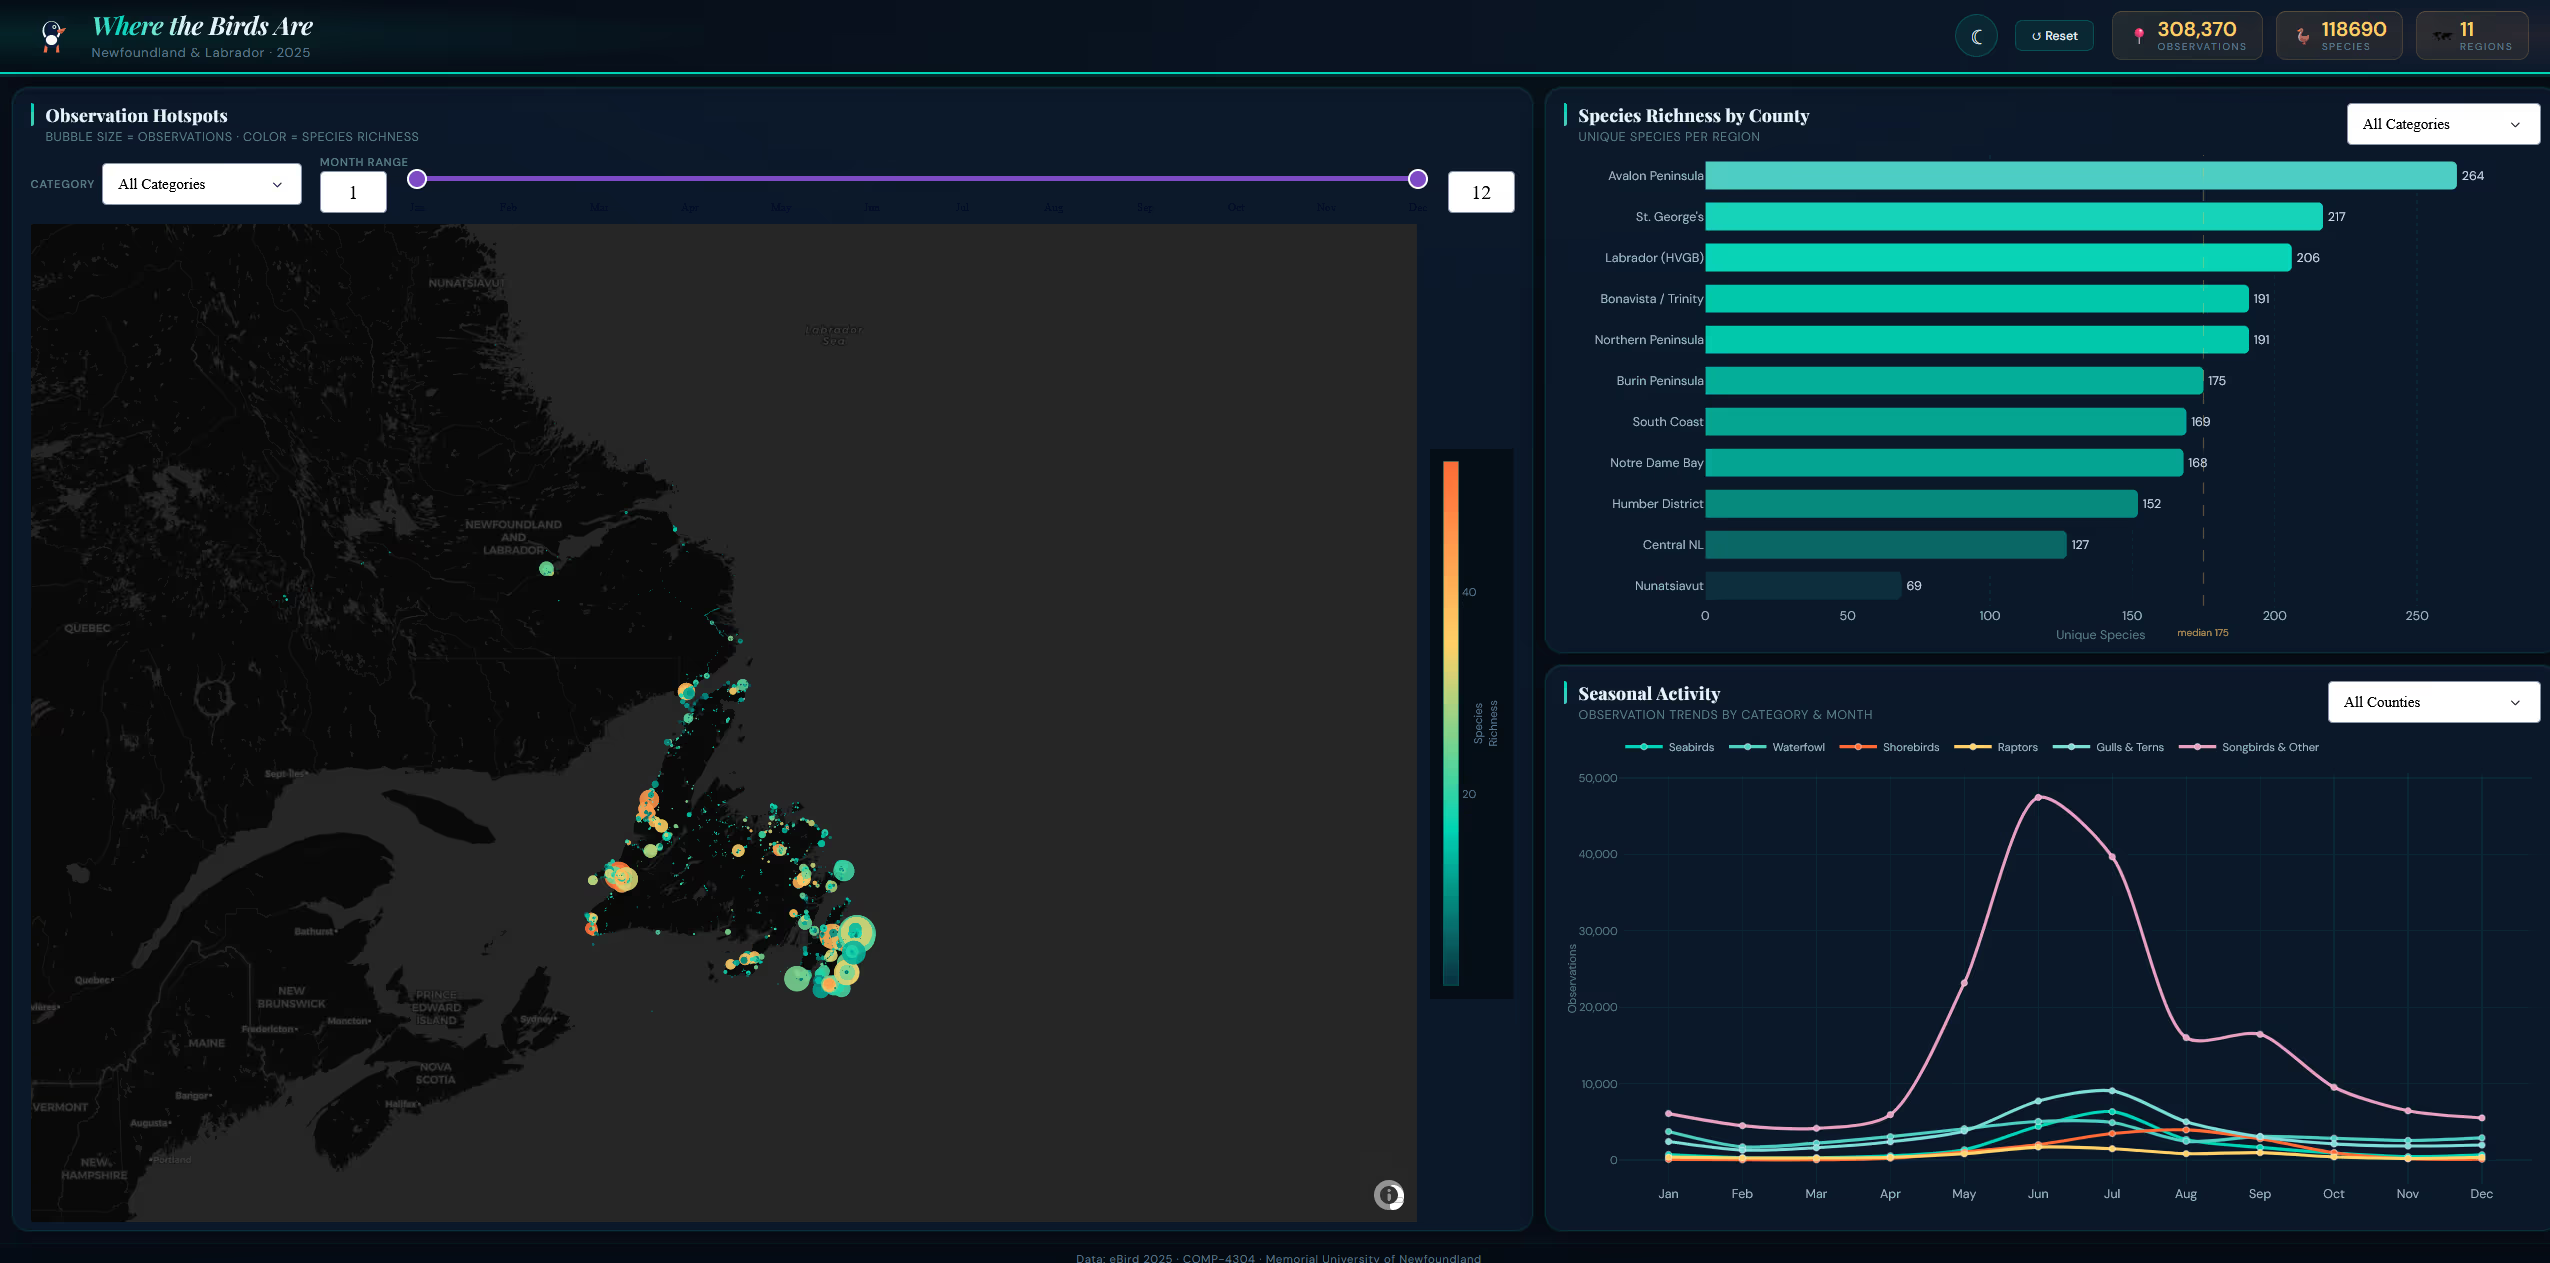
Plotly Dash · dark UI · linked filters across map and charts
Bubble map of NL localities with category and month-range filters; bubble size reflects observation volume and color shows species richness.
Horizontal bar chart ranking regions by unique species count, with a median reference line and category filter.
Multi-line chart of monthly observation trends by bird group, filterable by county to compare migration and breeding peaks.
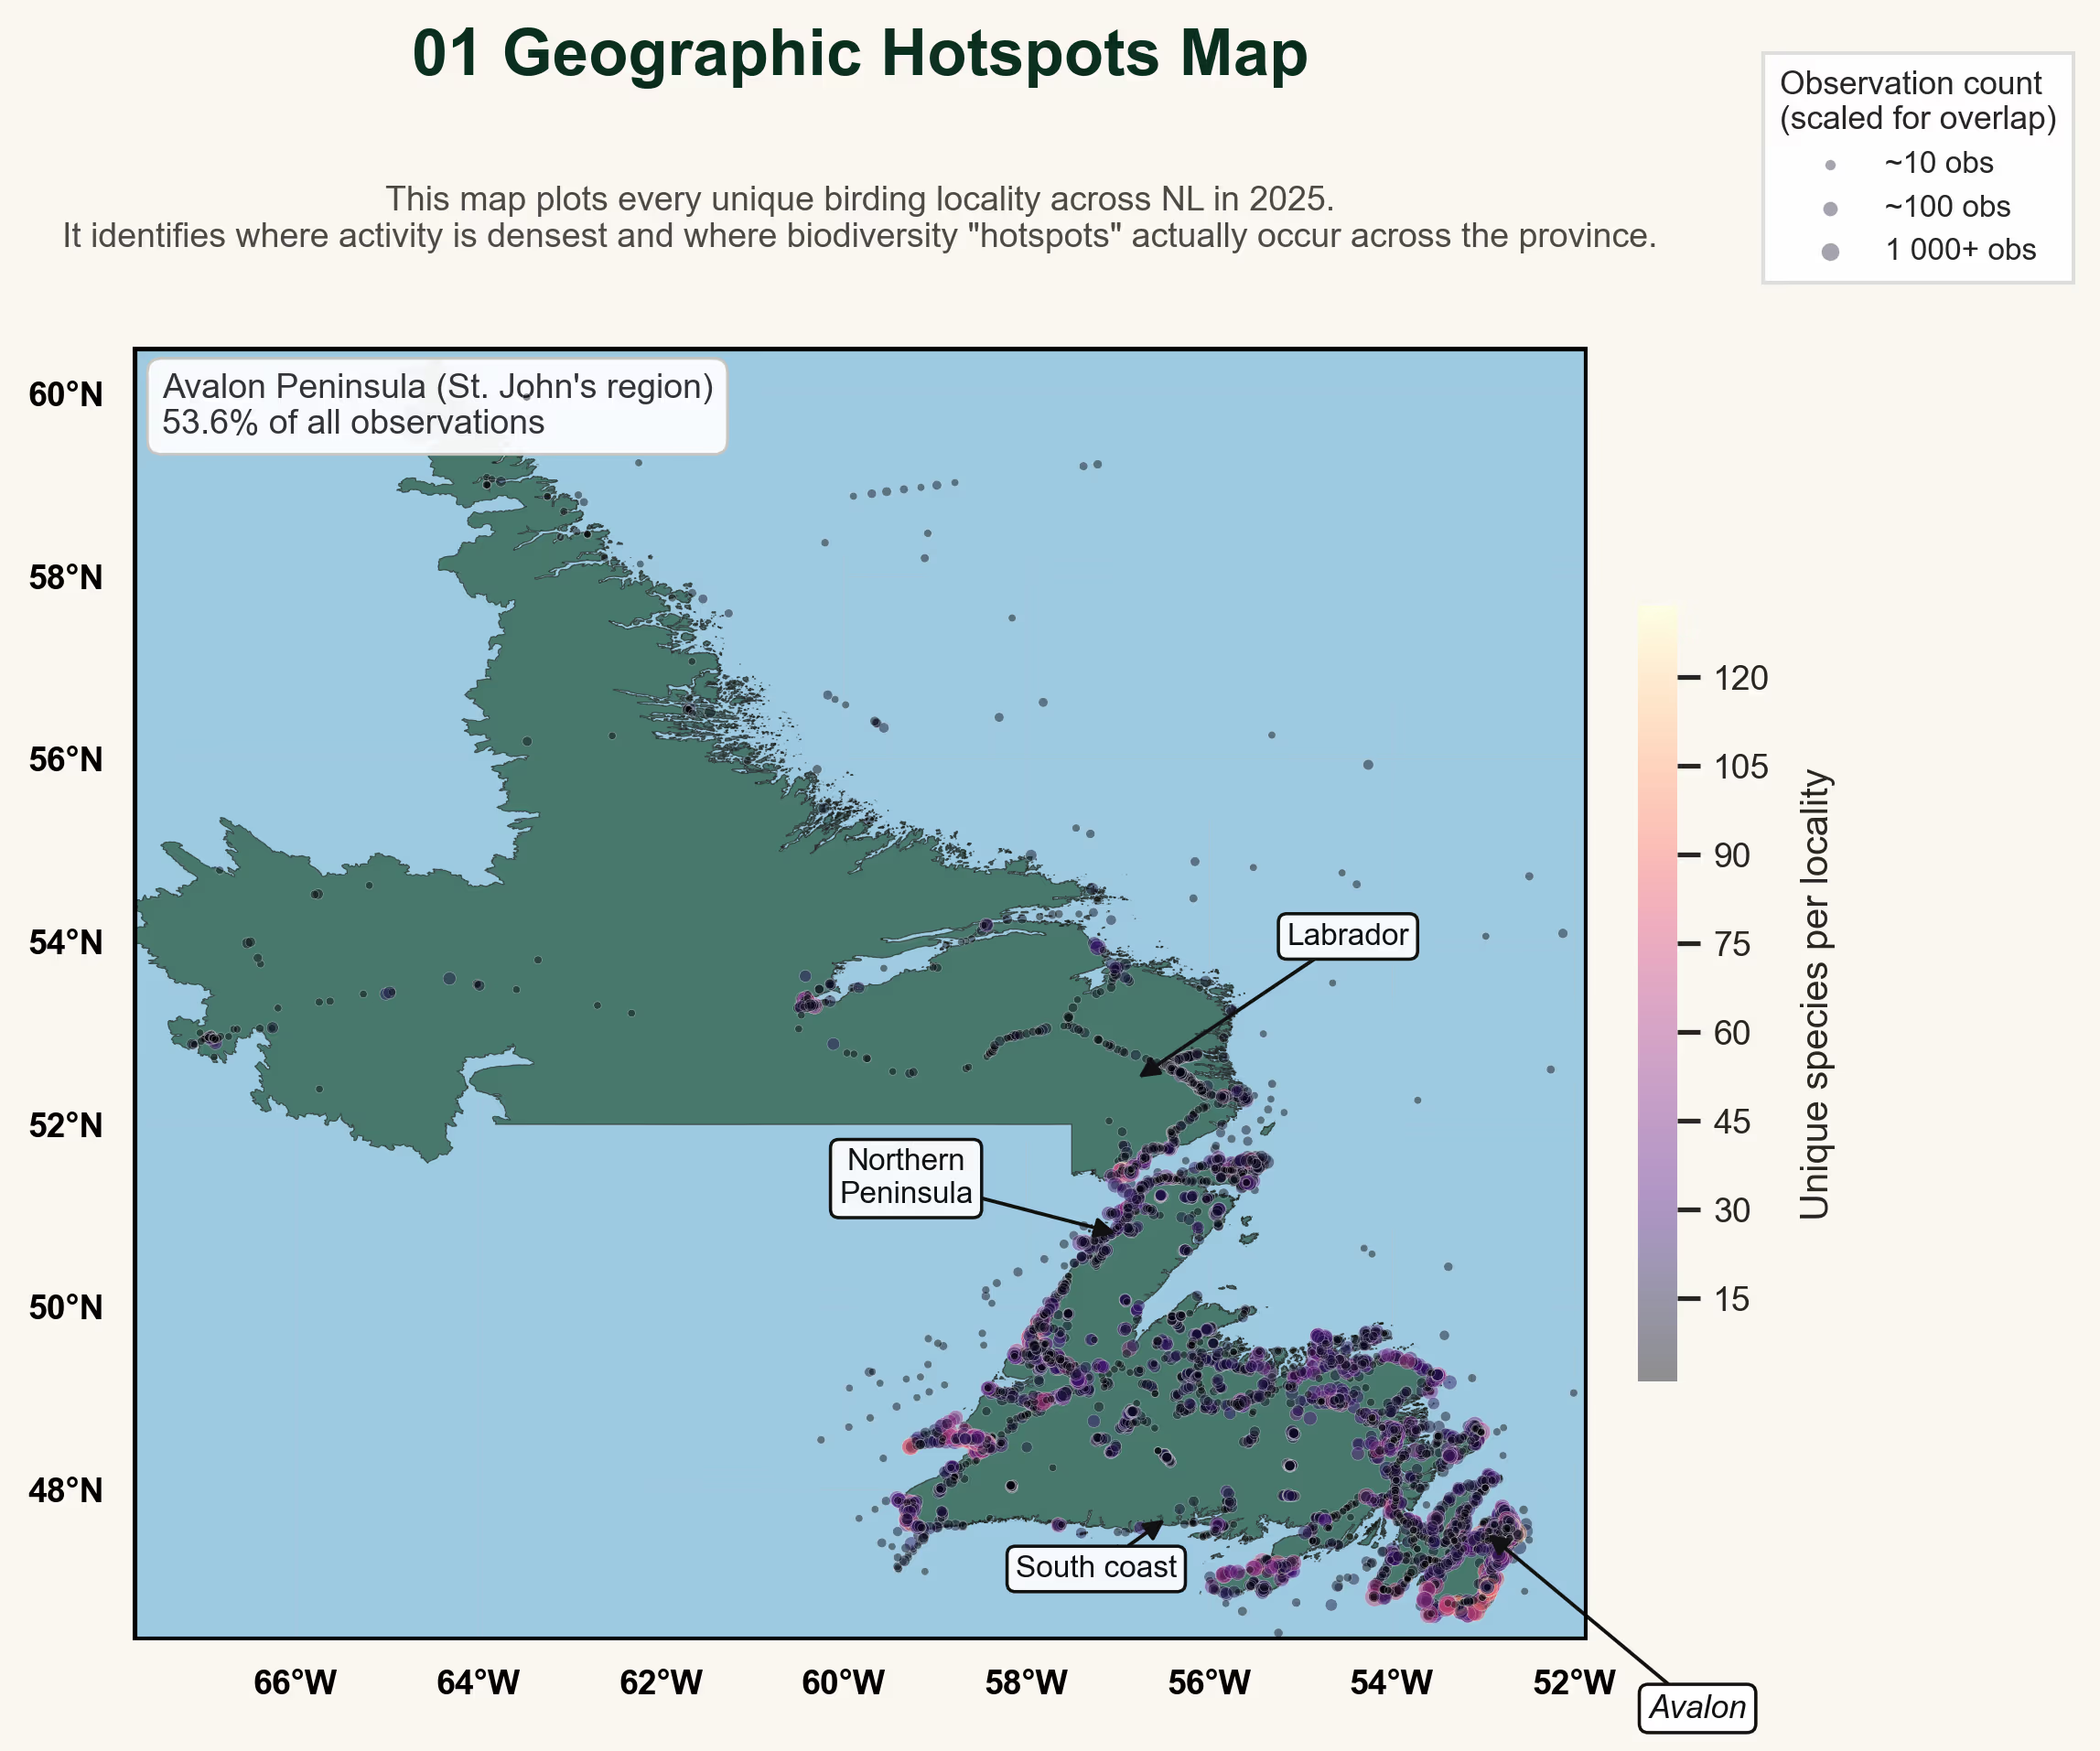
Scatter mapping of NL localities where marker size shows observations and color intensity shows species diversity.
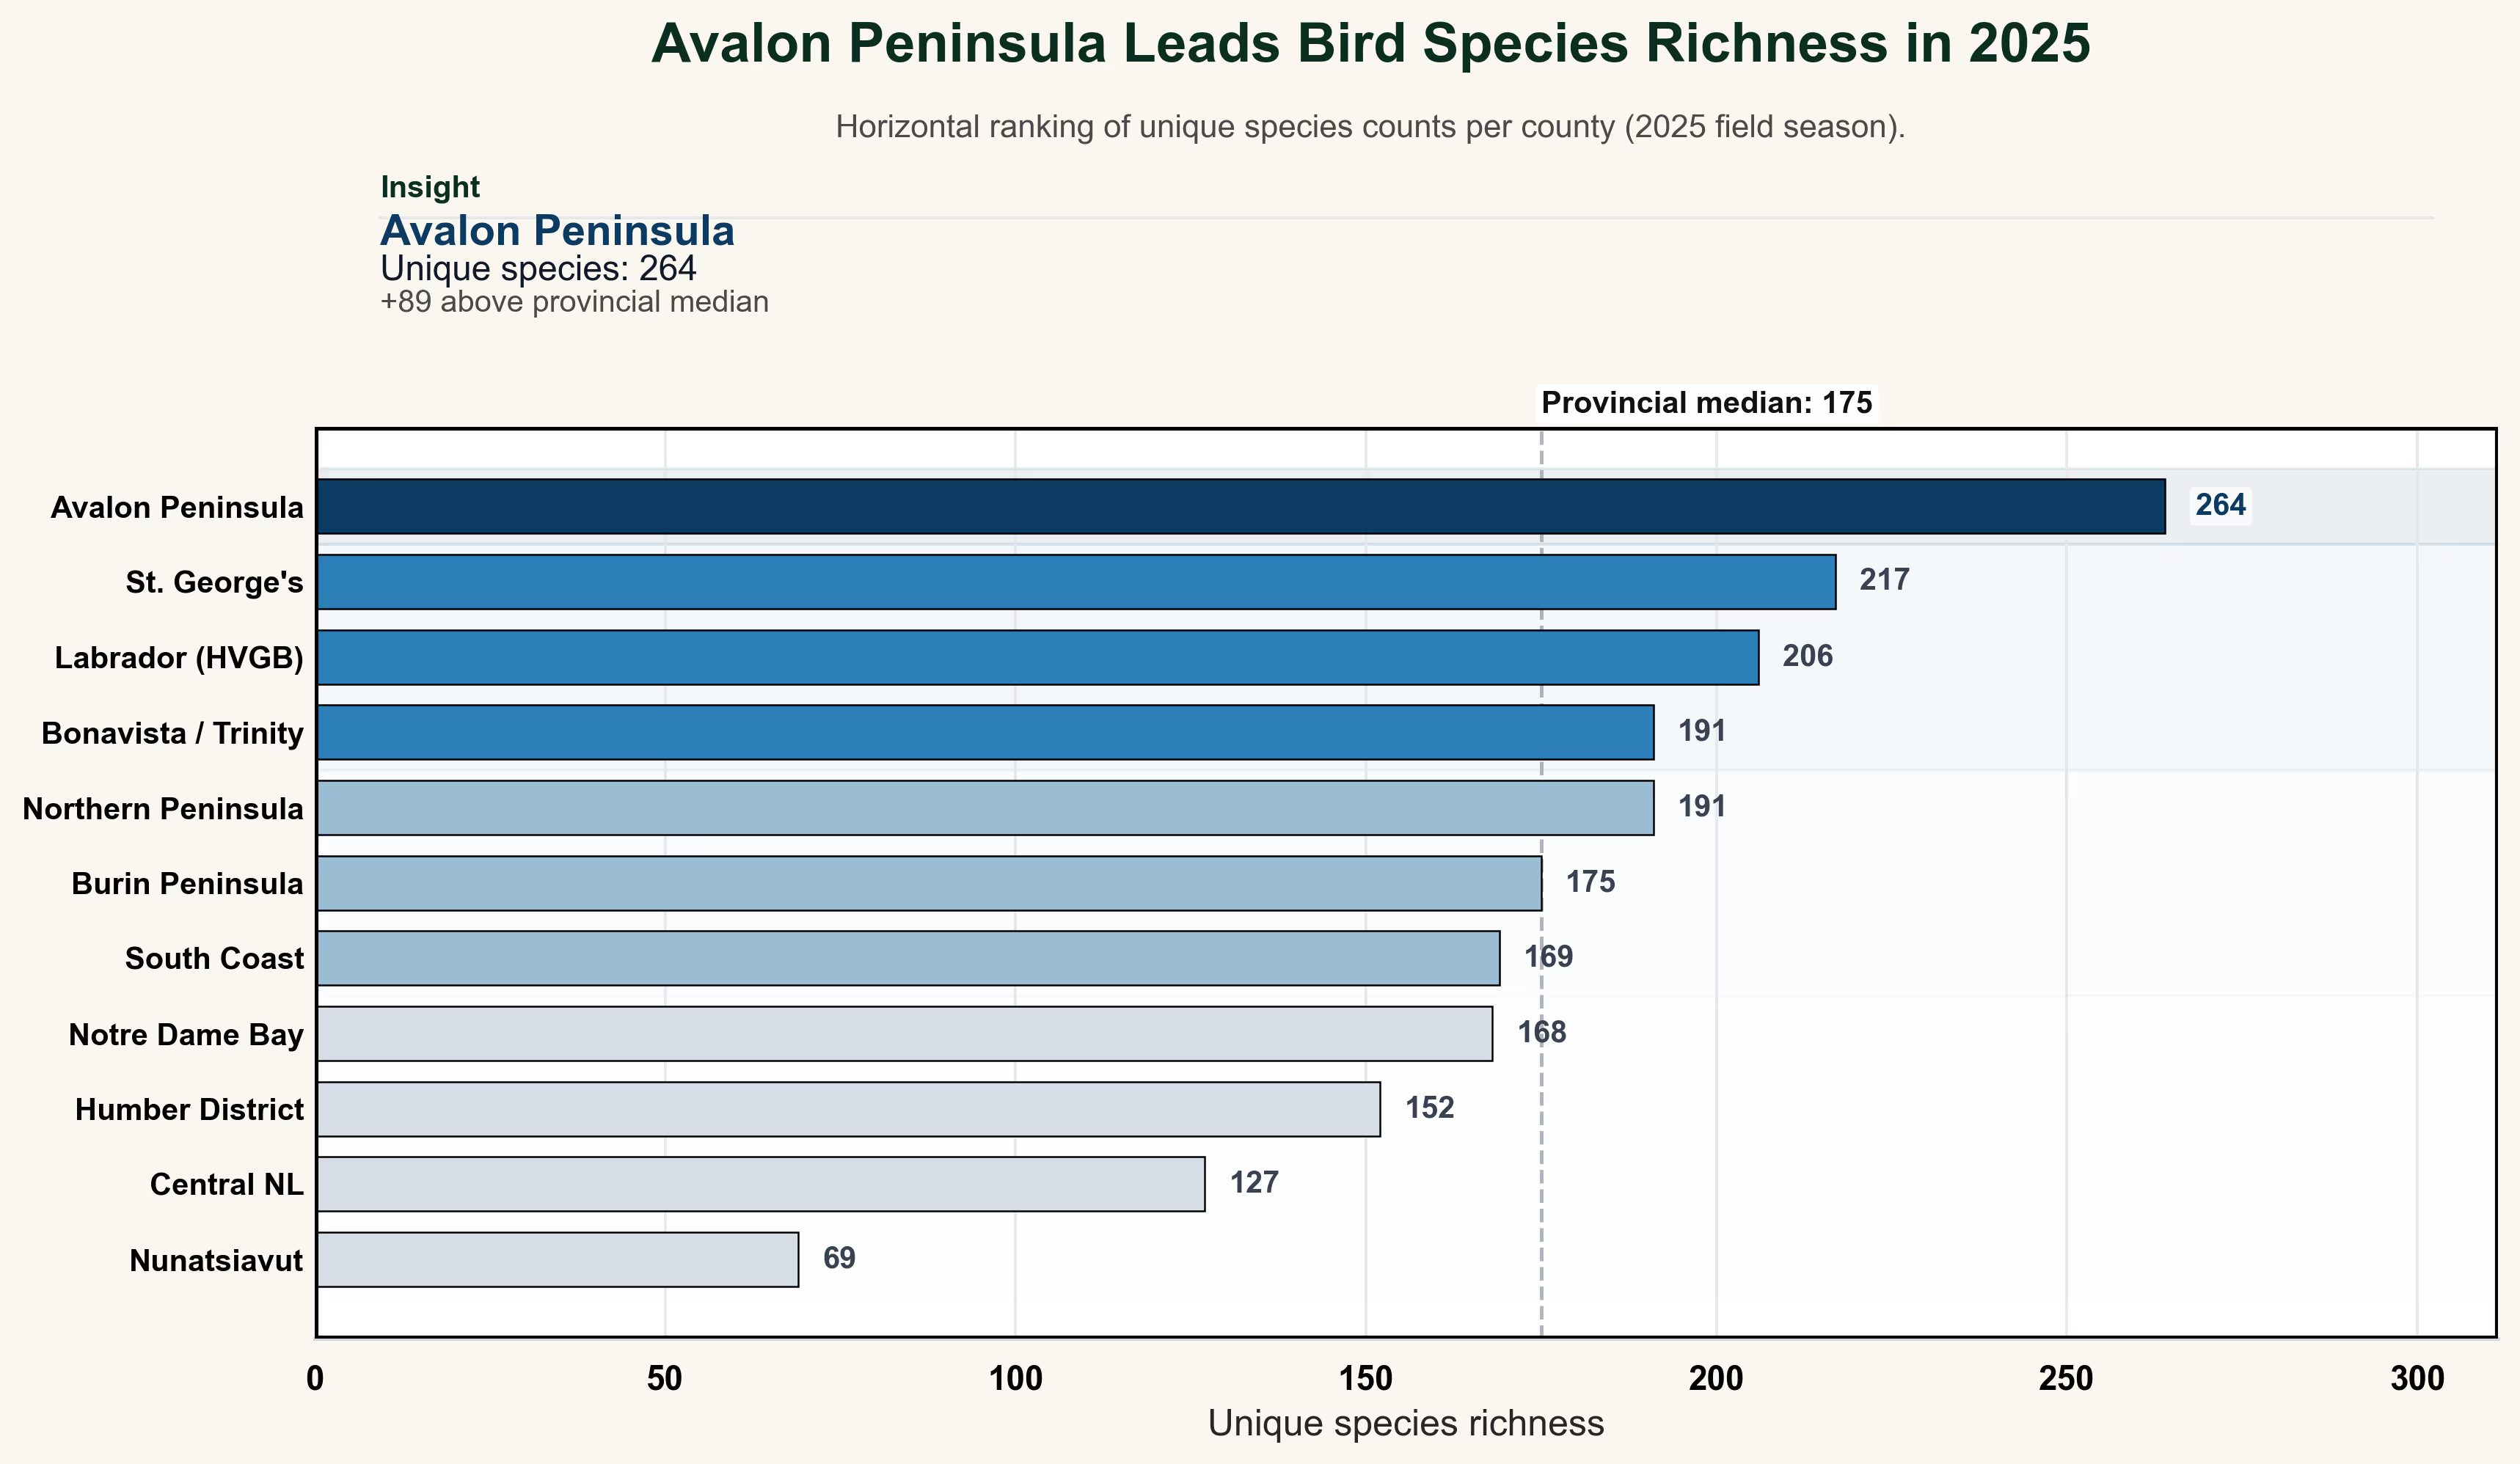
Horizontal ranking of all counties by unique species count with tiers and labels for quick comparison.
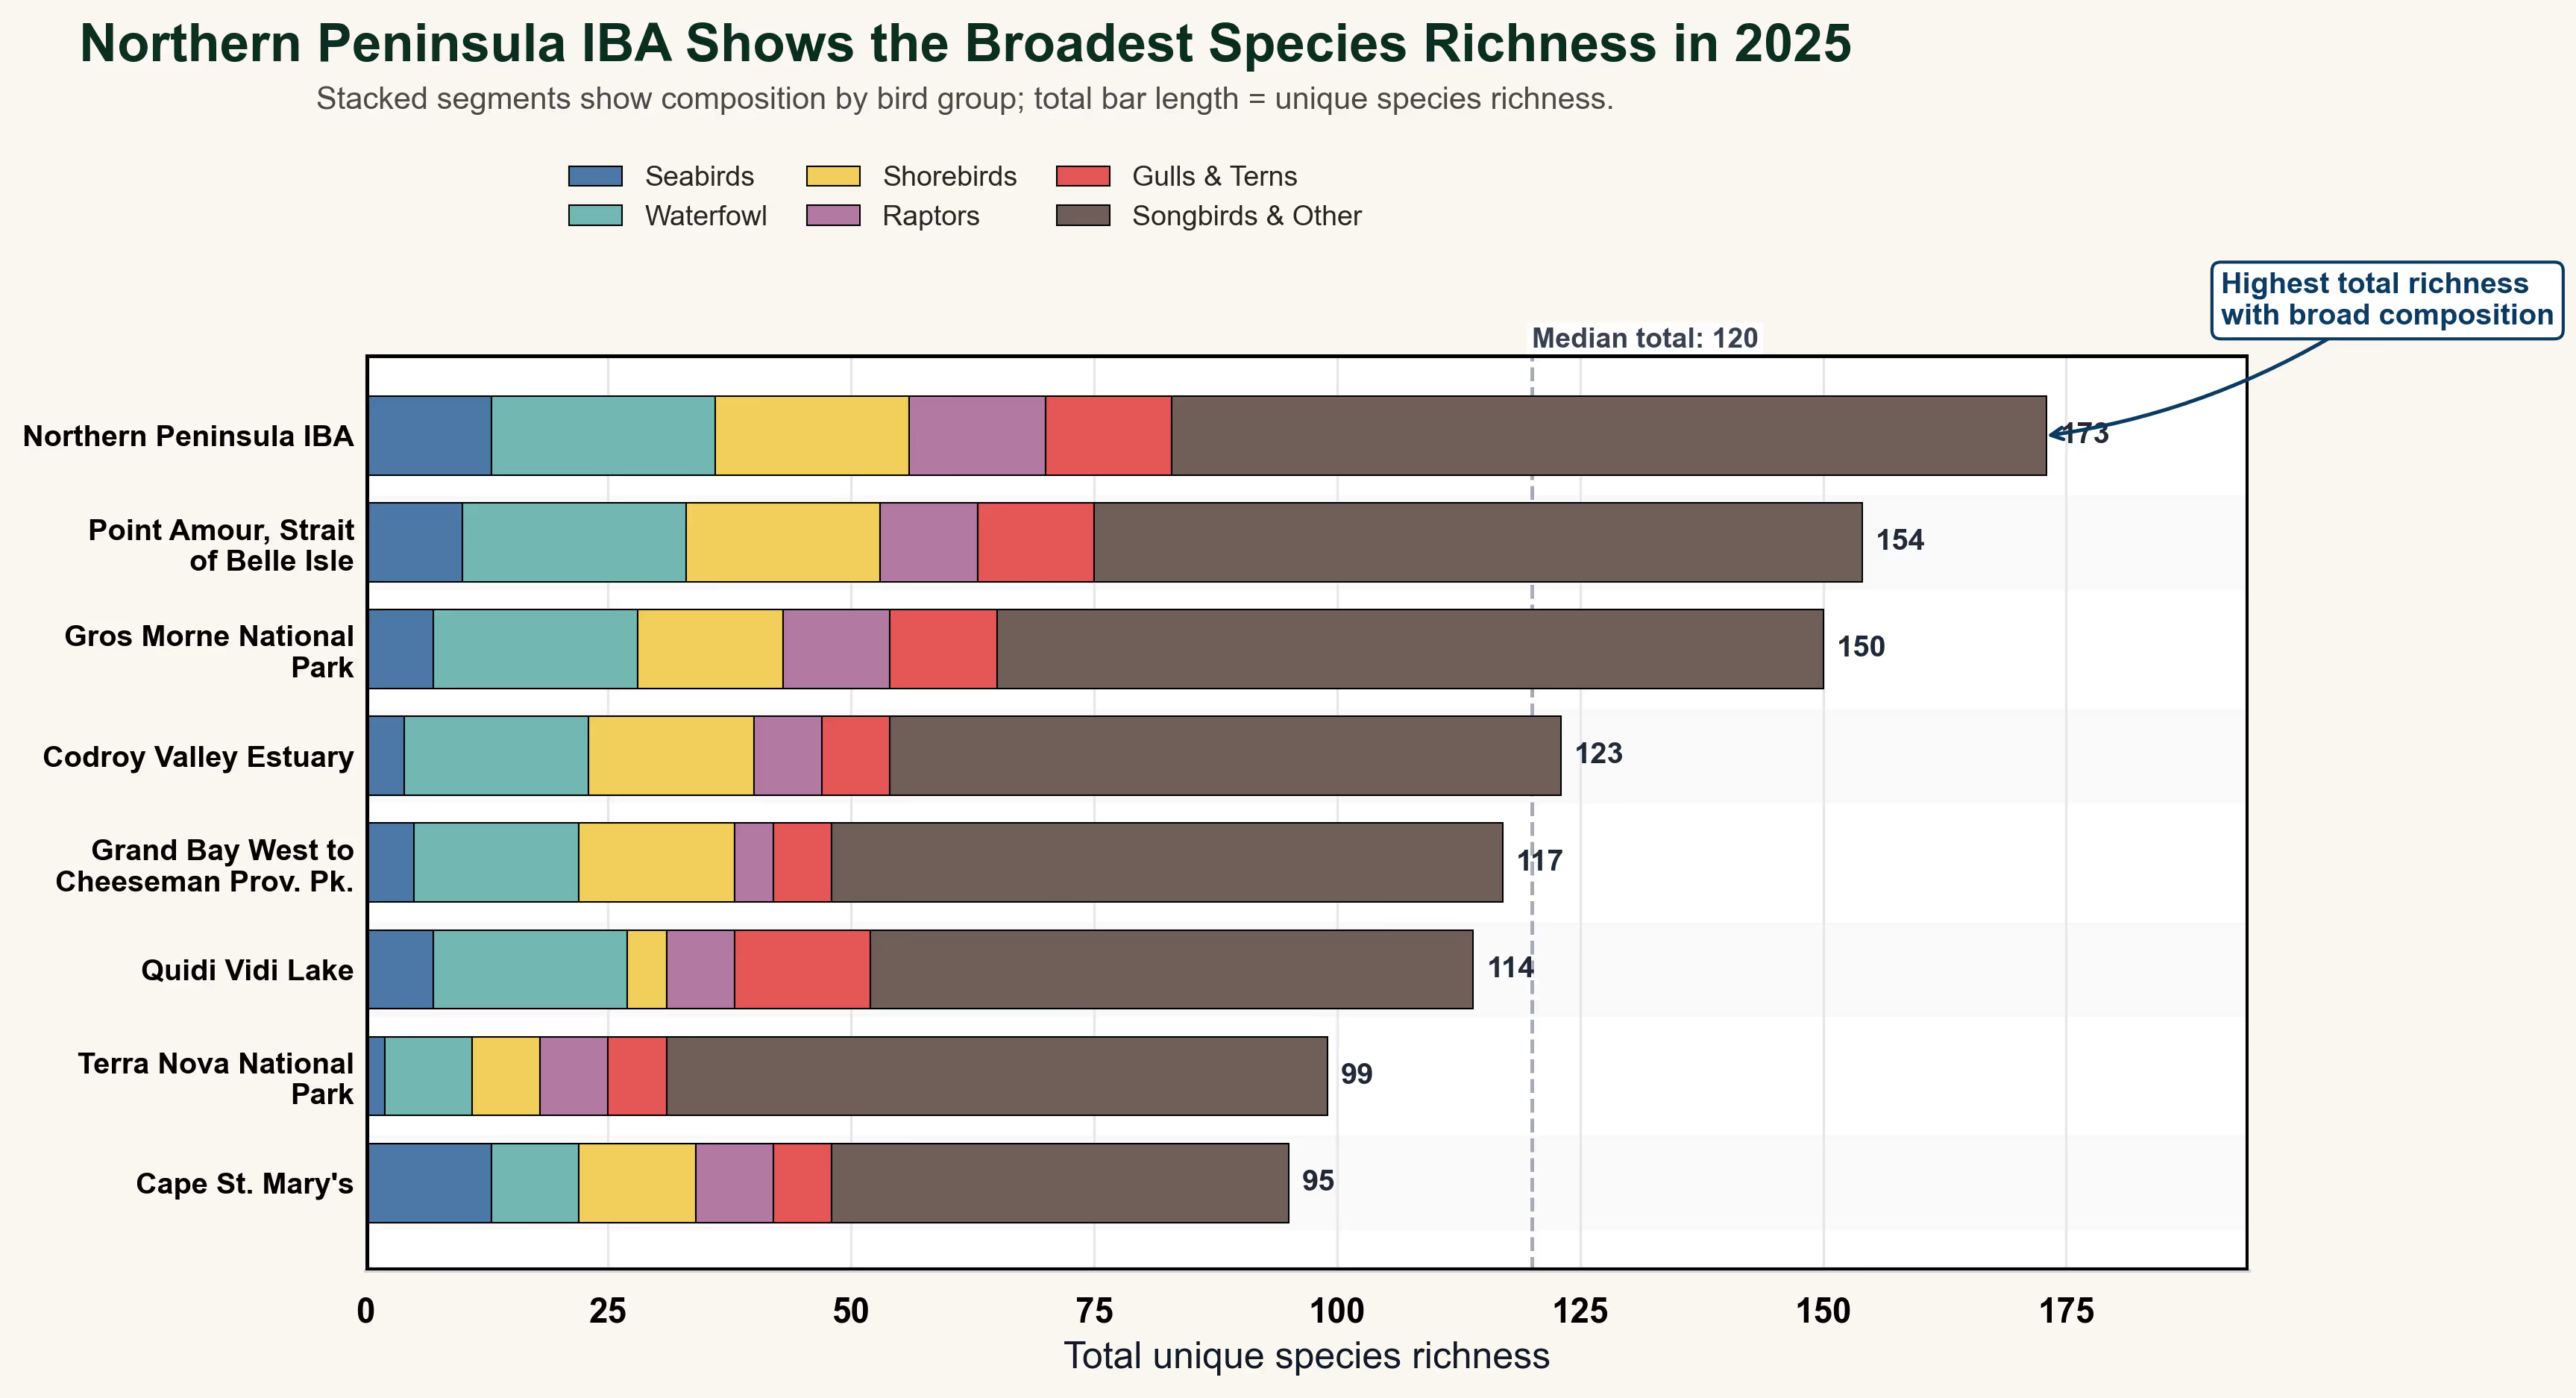
Stacked bars for top Important Bird Areas showing relative species-group composition across habitats.
Of all observations come from the Avalon Peninsula, reflecting access and birder density.
Species richness varies significantly across the province, with Avalon leading.
Distinct ecological profiles appear across coastal and inland Important Bird Areas.
Songbirds dominate most IBAs while seabirds lead in key coastal birding zones.